


What the data from 2025 means for your business in 2026
| WHAT YOU NEED TO KNOW – Solar did not contract in 2025 — it recalibrated. The companies gaining share are running better operations, not operating in better markets. – National average PPW on Solo’s platform: $4.40 cash and $4.92 financed across 1,000+ solar companies in all 50 states. – Arizona cash PPW grew 53.28% in a single year. Idaho grew 42.24%. These are not anomalies — they reflect what happens when proposal accuracy and deal structure improve. – TPO became majority share nearly overnight in multiple states. In Michigan, TPO went from 1.16% to 38.96% of deals — a 3,253% shift — in a single year. – Battery attach rates diverged sharply from offer rates. Hawaii closed 83.41% of proposals with storage. The states falling behind are usually stalling at the proposal step, not the homeowner conversation. – Data sourced from live proposals across 1,000+ solar companies in all 50 states. |
Looking back at 2025, the industry narrative was hard to escape: solar contracting, rates high, incentives disappearing, market in retreat.
By April 2026, that narrative has found real validation. Multiple large residential solar operators have entered restructuring since the market tightened, and the industry is absorbing the consequences of years of rapid scaling that outpaced operational discipline. The stress has not hit everyone equally, though. The companies that built accurate proposals, financeable deal structures, and consistent operational processes continued to grow through 2025. The ones that scaled volume faster than their foundations could support are now facing the hardest questions.
The data tells a more complicated — and more instructive — story.
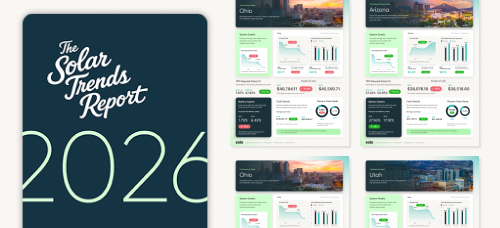
Every year, we publish a Solar Trends Report drawn from live proposal activity across Solo’s platform. This is not a homeowner survey or an analyst estimate. It is actual proposal data from more than 1,000 solar companies operating across all 50 states — what they quoted, how homeowners bought, what systems were sized at, and how financing patterns shifted in real sales environments.
We published the 2026 Solar Trends Report in April 2026, drawing on the full year of 2025 proposal activity across Solo’s platform. The data confirms that the market faced genuine headwinds — and it also shows something the headlines missed: in a tighter market, the gap between companies gaining share and those contracting had almost everything to do with how proposals were built.
Here is what we found.
| 1,000+ Solar companies in dataset | $4.40/W National avg cash PPW | $4.92/W National avg financed PPW |
Why did price per watt grow in some markets while it compressed in others?
The most direct answer: structural market factors set the baseline for each state, but proposal accuracy and deal structure determined where individual contractors landed within that baseline.
The national average cash PPW on Solo’s platform in 2025 was $4.40. The national average financed PPW was $4.92. But the state-level picture is where the data gets interesting.
Arizona grew cash PPW by 53.28% year over year — the most dramatic single-year growth of any state in the dataset. Idaho grew 42.24%. California grew 10.58%. These are not similar markets. Arizona and Idaho have different utility rate structures, different incentive environments, and different buyer demographics. What they share is a cohort of operators who built more accurate proposals, sized systems to what sites actually supported, and structured deals to hold up at lender review.
At the other end, states that saw significant shifts toward TPO — which carries different lender requirements and proposal structures than traditional loans — often saw cash PPW compress as the remaining cash deal pool became concentrated in a narrower set of operators and deal types.
| +53.28% Arizona cash PPW growth YoY | +42.24% Idaho cash PPW growth YoY | +10.58% California cash PPW growth YoY |
Did TPO growth hurt contractor margins or help them?
It depended almost entirely on whether the contractor’s proposal workflow was rebuilt for TPO structures. In states where TPO became majority share and contractors had adapted, financed PPW held. In states where teams kept running loan-era workflows on TPO deals, both volume and margin compressed.
The TPO shift itself was expected. The Section 25D tax credit sunset and persistent interest rate sensitivity made lease and PPA structures more attractive to homeowners in many markets. What surprised us in the data was how fast some markets moved.
In Michigan, TPO went from 1.16% of total deals to 38.96% in a single year — a 3,253% shift. Connecticut moved from 9.23% to 50.00% (+441%). Illinois went from 2.71% to 52.88% (+1,849%). In each of these states, majority share flipped in twelve months.
The contractors maintaining strong PPW inside that shift were the ones who had rebuilt for TPO — accurate production modeling, lender-aligned documentation, proposal structures that matched what TPO financing partners actually required. The ones who saw compression were running the same workflow they built for loans.
| TPO becoming majority share was expected. What the data shows inside that shift is more interesting: some contractors held margin. Others didn’t. The difference shows up in the proposals. |
It is also worth noting that TPO is not available in every state. Alaska, Arkansas, Indiana, Iowa, Kansas, and several others prohibit lease and PPA structures entirely. For contractors operating across state lines, the deal type mix — and the proposal workflow it requires — varies significantly by market.
Why are some contractors closing more battery deals than others?
Because closing with a battery requires a different proposal than offering one. Contractors with strong attach rates are building proposals that model the right scenario for that homeowner, make the financial case clearly, and connect to financing without manual assembly. Contractors with low attach rates are often having the battery conversation — but the proposal is not closing it.
Battery attach rates in our dataset reflect actual closed proposals that included storage — not how often reps are presenting storage in conversation. That distinction matters.
Hawaii led all states at 83.41% attach. California followed at 66.89%. Delaware jumped from 6.29% to 57.14% in a single year — an 808% increase — driven in large part by market conditions that made self-consumption and backup power compelling, combined with proposals that could model those scenarios clearly and connect to financing without friction.
Louisiana grew attach rates from 16.79% to 38.00%. Arkansas went from 1.55% to 7.48% (+383%). Alabama from 2.77% to 14.86% (+436%). In every high-growth case, the pattern is the same: a proposal that made storage financially legible for the specific homeowner, not a general pitch about backup power.
| 83.41% Hawaii battery attach rate | 66.89% California battery attach rate | 6.29% → 57.14% Delaware YoY growth |
How are homeowners actually buying solar in 2025?
It depends on the state. There is no single national answer, and a sales process built around a national average will underperform in almost every individual market.
Cash deal percentages in our dataset vary by more than 80 percentage points between the highest and lowest states. Minnesota came in at 88.52% cash deals in 2025. Iowa was 35.21%. Louisiana jumped dramatically as market dynamics shifted, reaching 32.35% cash — up from 11.38% the prior year.
These patterns are driven by structural factors: utility rates, TPO availability, buyer demographics, and market maturity. Understanding which factors are driving your specific market is a prerequisite for building the right proposal. A cash-dominant market rewards a savings and ROI narrative. A financed market rewards monthly payment clarity and lender-ready accuracy. A TPO market requires a different value proposition entirely.
| 88.52% Minnesota cash deals | 35.21% Iowa cash deals | 11.86% Florida cash deals |
Is solar loan compression a market problem or an operations problem?
In many cases, it is an operations problem. Loan compression was real and widespread in 2025. But the data shows that contractors who expanded scope — larger, more accurately sized systems, better-bundled proposals, storage integrated cleanly into financing — grew deal value even in markets where averages compressed.
Delaware is one of the clearest examples. Average loan values grew to $85,402.81 in 2025 — up 37.82% year over year — driven largely by system sizes growing 50.22%. Delaware was the second-largest average system size in the country. That is not a market story. It is a scoping story.
Colorado loan values grew 14.33% as system sizes expanded nearly 21%. Maine held nearly flat while many surrounding markets saw compression. The operators driving those numbers were not in uniquely favorable conditions. They were scoping more accurately, bundling more into each proposal, and building the financial case for a system that matched what the site actually needed.
| Loan compression is not inevitable. It is the result of under-sized, under-bundled proposals. The fix is not better selling. It is better proposals built on accurate production data. |
How do I know if my solar business is performing well in my market?
Compare your PPW — broken out by deal type — against your state’s benchmark in this report. If you are below the state average on your primary deal type, that is a signal worth investigating. If you are at the national average but significantly below your state average, you are underperforming your market.
National averages are a useful orientation point. They tell you where your market sits in the national picture. But the number that tells you whether your specific business is competitive is your state’s PPW benchmark on your primary deal type.
That is exactly what we built this report to provide.
The 2026 Solar Trends Report includes state-by-state breakdowns for all 50 states, covering average PPW (cash and financed), system size trends, TPO share, battery attach rates, average loan values, and cash deal percentage — each benchmarked against the national average.
| View the 2026 Solar Trends Report All 50 states. Real proposal data. No form required. DOWNLOAD HERE |  |
Frequently asked questions about the 2026 Solar Trends Report
What is the national average price per watt for solar in 2025?
Based on proposal data from 1,000+ solar companies on Solo’s platform, the national average PPW in 2025 was $4.40 per watt for cash deals and $4.92 per watt for financed deals. These figures reflect actual proposal pricing at the point of sale across residential solar installations — not design-stage estimates, commercial project data, or survey-reported figures. Methodology differences explain why figures from other reports may vary.
Which states had the highest solar price per watt in 2025?
Hawaii led all states at $7.19 per watt cash and $8.07 per watt financed — driven by high utility rates and strong homeowner demand. Idaho was second nationally at $6.40 per watt cash, growing 42.24% year over year. California came in third at $6.07 per watt cash, growing 10.58%. Arizona reached $5.28 per watt cash with the largest single-year PPW growth in the dataset at 53.28%.
How has TPO changed solar deal structures in 2025?
TPO (third-party ownership, including leases and PPAs) grew sharply in 2025 following the Section 25D tax credit sunset. In Michigan, TPO share went from 1.16% to 38.96% in a single year. Connecticut moved from 9.23% to 50.00%. Illinois went from 2.71% to 52.88%. In each of these states, the majority of deals shifted to TPO structures within twelve months. TPO is not permitted in all states — Alaska, Arkansas, Indiana, Iowa, and Kansas are among those that prohibit these structures.
What is a battery attach rate in solar and why does it matter?
Battery attach rate is the percentage of closed proposals that included a battery storage system. It is distinct from how often contractors are presenting storage in conversation. In 2025, Hawaii led all states at 83.41%, followed by California at 66.89%. Delaware grew its attach rate from 6.29% to 57.14% in a single year. Attach rate is a more useful performance metric than offer rate because it reflects what proposals are actually closing.
Why do different solar industry reports show different national PPW figures?
Different reports measure different things at different stages of the sales process. Solo’s figures reflect actual residential proposal pricing at point of sale — what contractors quoted homeowners in a closed proposal. Reports drawing on design-stage data, commercial project volumes, or homeowner and installer surveys will produce different figures. For contractors benchmarking their own pricing, the most useful comparison is their state’s benchmark on their primary deal type within a consistent dataset.
Where can I find solar market data by state?
Solo’s 2026 Solar Trends Report includes a dedicated page for all 50 states covering average PPW (cash and financed), TPO share, battery attach rates, average system size, average loan value, and cash deal percentage — each benchmarked against the national average. The report is available here with no registration required.
About this data
The 2026 Solar Trends Report draws on live proposal activity processed through Solo’s platform during 2025. The dataset covers more than 1,000 solar companies operating across all 50 states. Metrics include price per watt (cash and financed), average system size, TPO proposal share, battery inclusion rates, average loan values, and cash deal percentage. All figures reflect residential proposals at the point of sale. Where sample sizes did not meet Solo’s data integrity standards, metrics are marked accordingly in the full report. Figures are not directly comparable to reports drawing on design-stage data, commercial project volumes, or survey-derived pricing.