image
2026 SOLAR TRENDS REPORT

Derived from millions of proposals generated by over 1,000 solar companies.

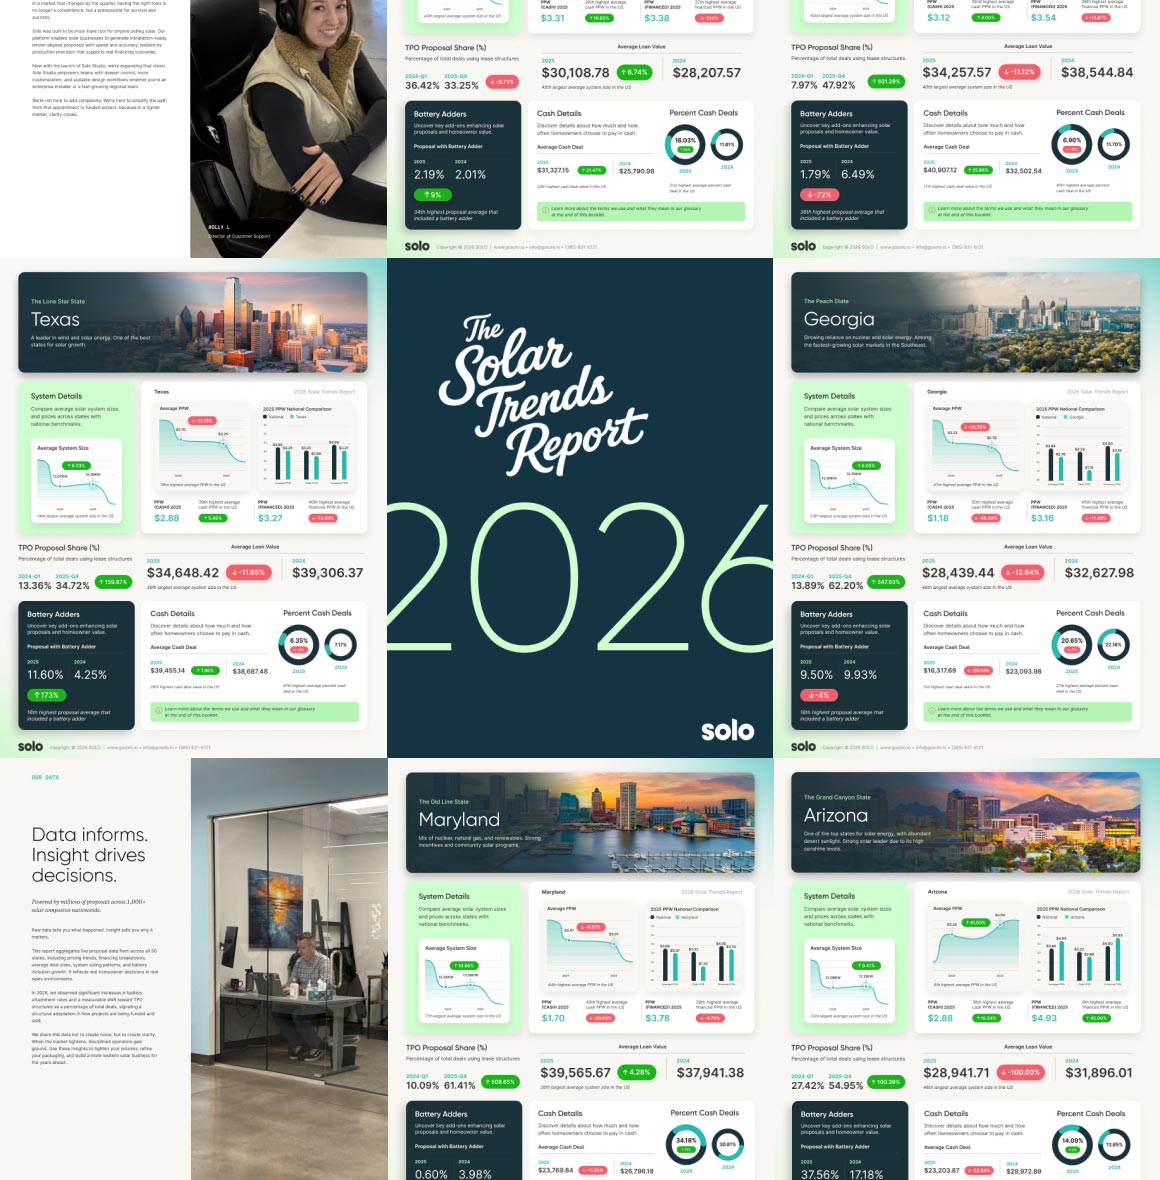
The 2026 Solar Trends Report provides benchmarks to improve fundability, increase attachment rates, and protect margins in a changing market.

What’s Included:

  • Get the average PPW for cash and financed systems by state.
  • Learn how each state is handling the growth of leases as a new financing option
  • See the growth or decline of systems that include storage
  • See the growth or decline of systems that include storage
Download Now
HOW TO USE

Turning volatility into strategic advantage

Solar executives and sales leaders use this report to benchmark performance, refine their financing strategy, and better understand where the market is heading.

WHY IT MATTERS

Built From Actual Residential Proposal Data

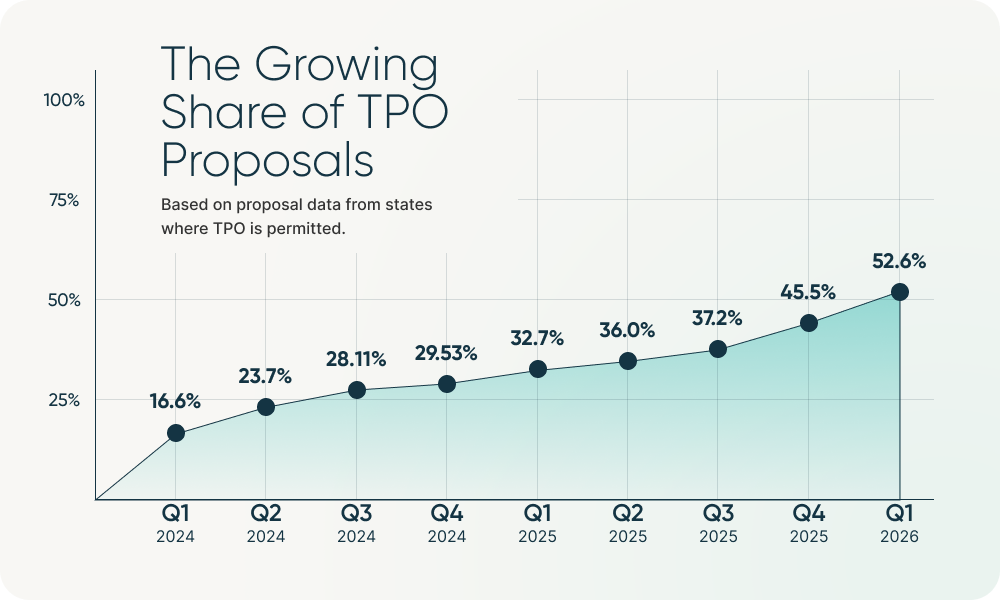
The reports proposal-level perspective provides early signals into how homeowner demand, financing preferences, and battery adoption are evolving across the market.

Some key findings from the 2026 Solar Trends Report

Battery Attachment Continues to Climb

Battery inclusion in solar proposals continues to rise, signaling a growing homeowner preference for resilience, energy independence, and greater control over how solar energy is stored and used.

Average Deal Sizes Continue to Decline

Average financed deal values fell 5.9% while cash deal amounts dropped 12.5%, reflecting a shift toward smaller system configurations and tighter project economics.

Price Per Watt Holds Steady

In 2025, average ppw remained largely consistent with 2024 levels, indicating that while financing and system size shifted, core system pricing stayed relatively stable.

It’s not just a proposal tool. Our entire organization relies on Solo. It’s really cool that all the information is in one place and easily accessible by all the different departments.

DANIEL HARTZOG

Executive Director of Business Development